Movement, ticket times, table turns, and inventory signals
EVA is the computer-vision layer in DASH. The figures on this page are sample data for a fictional location, Corner Grill. Facial recognition is off by default. This is about workflow, not a surveillance scoreboard.
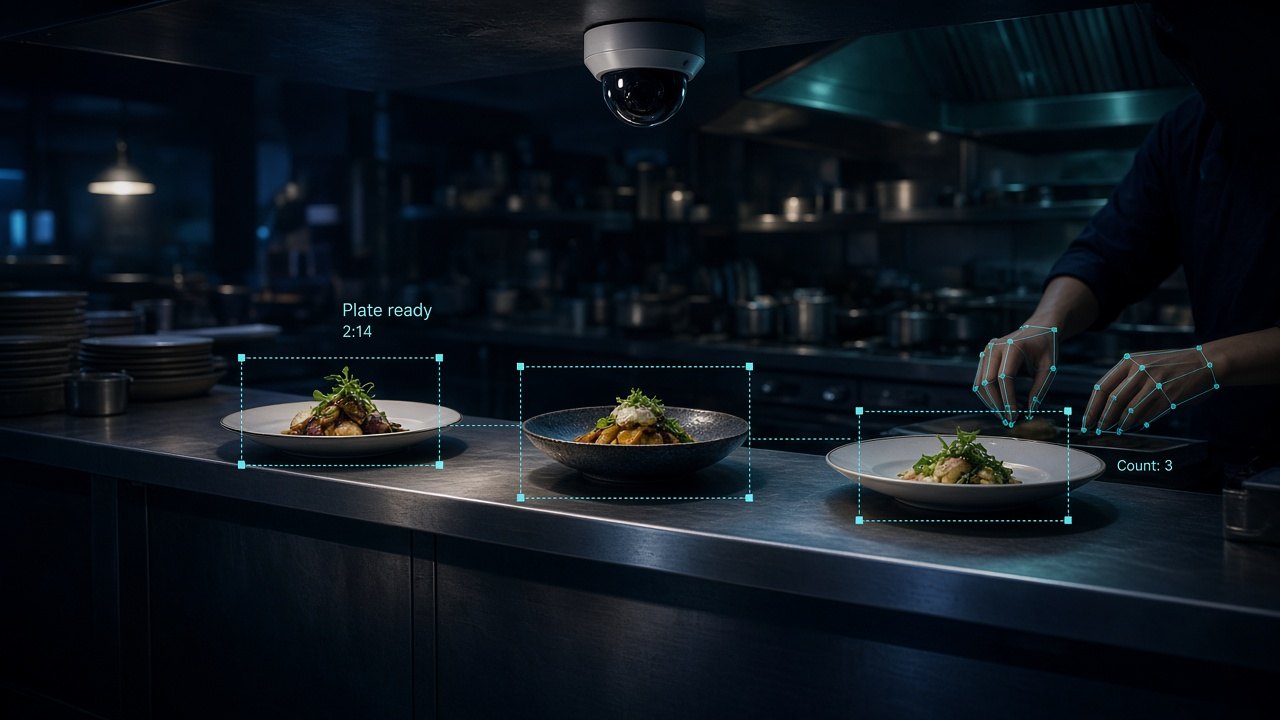
Illustration — not a product photo Original artwork of a camera over the pass with sample detection overlays. This is not a live feed and not an official UI from another brand.
Jump to a topic, or start with hardware and placement. Every topic has its own section, an illustration, and labeled sample metrics.
SampleLive heatmaps on the roadmap
1. Employee movement — workflow, not surveillance
EVA is designed to watch stations and paths so a manager can see whether the line is covered during a rush. It is not built as a tool to score individual workers by face. Facial recognition is off by default and is not shown in this demo.
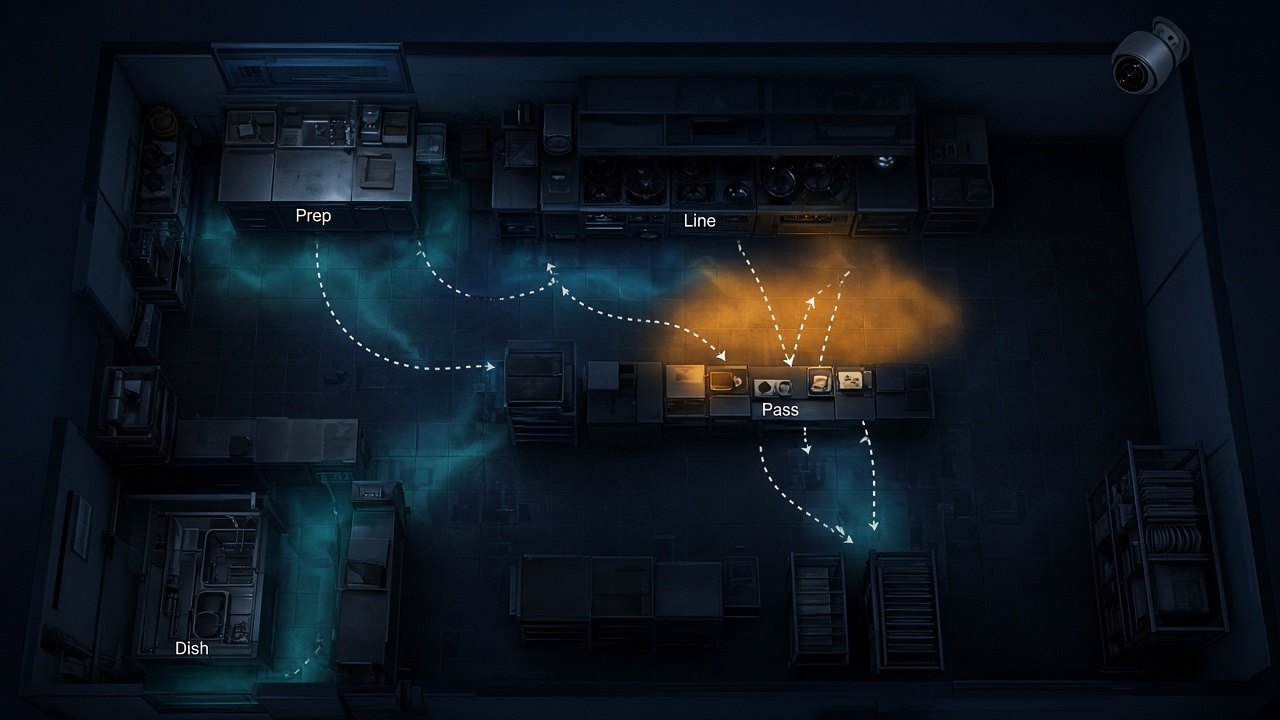
Illustration — not a product photo A sample station-coverage heatmap for Corner Grill. Color on the floor is an illustration of busy paths and a pass bottleneck, not a live tracking view of named employees.Illustration — not a product photo Sample metrics card. Illustration of a dashboard, not a screenshot of a live system.
During a rush, the useful question is usually “is the station staffed?” not “where is this person?” EVA’s movement view is planned around work areas:
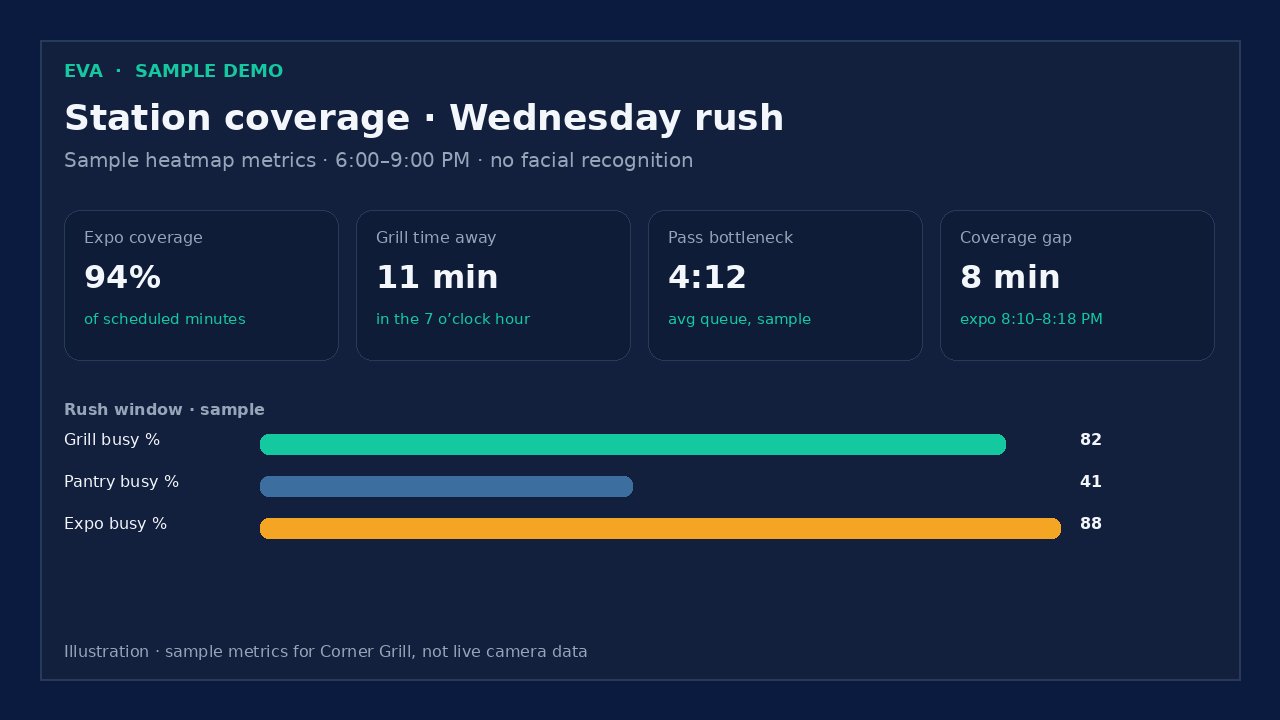
Station coverage heatmaps. Warm color builds where tickets, plates, and foot traffic concentrate — typically the pass, the grill, or a drinks well. Cooler color shows quieter prep or dish. The map is about the floor plan, not a named face.
Time away from station. If the grill is empty while tickets are on the board, the demo can show minutes the station was uncovered in an hour. That is a coverage clock, not a break-room camera (break rooms and restrooms are not EVA camera locations).
Bottleneck spots. When plates stack at the pass or runners cross the same aisle, the map marks a bottleneck so a manager can add an expo, move a trash can, or change a firing pattern.
Steps per order. Path traces can estimate how far a ticket travels from prep to the pass. The sample figure of 48 steps is a planning estimate from those traces, not a pedometer on a person and not a productivity score.
Idle vs busy. A station can look idle because the book is light, or busy because one person is covering two wells. Side-by-side busy percentages help a manager rebalance the next rush, not dock a paycheck.
Coverage gaps during rush. A short gap — eight minutes with no expo between 8:10 and 8:18 PM in the sample — is the kind of hole that shows up later as slow-service reviews.
What is in the demo today is a sample heatmap illustration and the metrics below. Continuous, live movement maps from the cameras are on the roadmap. EVA does not use facial recognition by default; if a future option is ever offered, it would be a disclosed, off-by-default setting, not the standard workflow view.
Expo coverage94%of scheduled minutes, 6–9 PM rush
Grill time away11 minuncovered in the 7 o’clock hour
Pass bottleneck4:12average queue at the pass
Coverage gap8 minexpo short, 8:10–8:18 PM PT
Steps per order48sample path estimate, not a wearable
Grill busy82%7–8 PM, vs pantry 41% idle-leaning
Sample data Figures are labeled samples for the fictional Corner Grill location. They are not measured results from a live restaurant and not a promise of performance.
SampleKDS connection on the roadmap
2. Ticket times — fire to pass, then pass to table
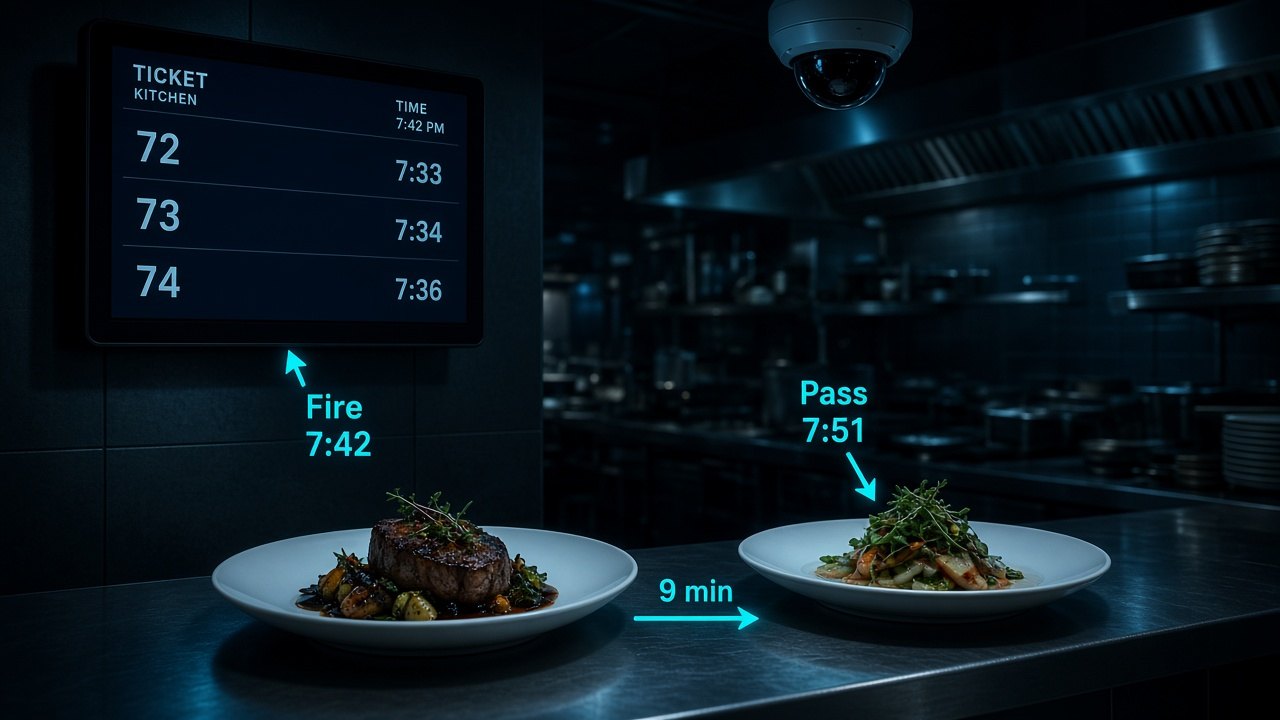
A plate can be late because it cooked slowly, or because it sat at the pass. EVA is designed to time both legs of the trip and to sit next to the fire stamp from a kitchen display system.
Illustration — not a product photo Sample fire-to-pass timing on an original illustration. The wall screen is a generic ticket board, not a Toast or other vendor’s interface.Illustration — not a product photo Sample ticket-time metrics. Not a live kitchen-display feed.
Each dish and each station can carry its own clock:
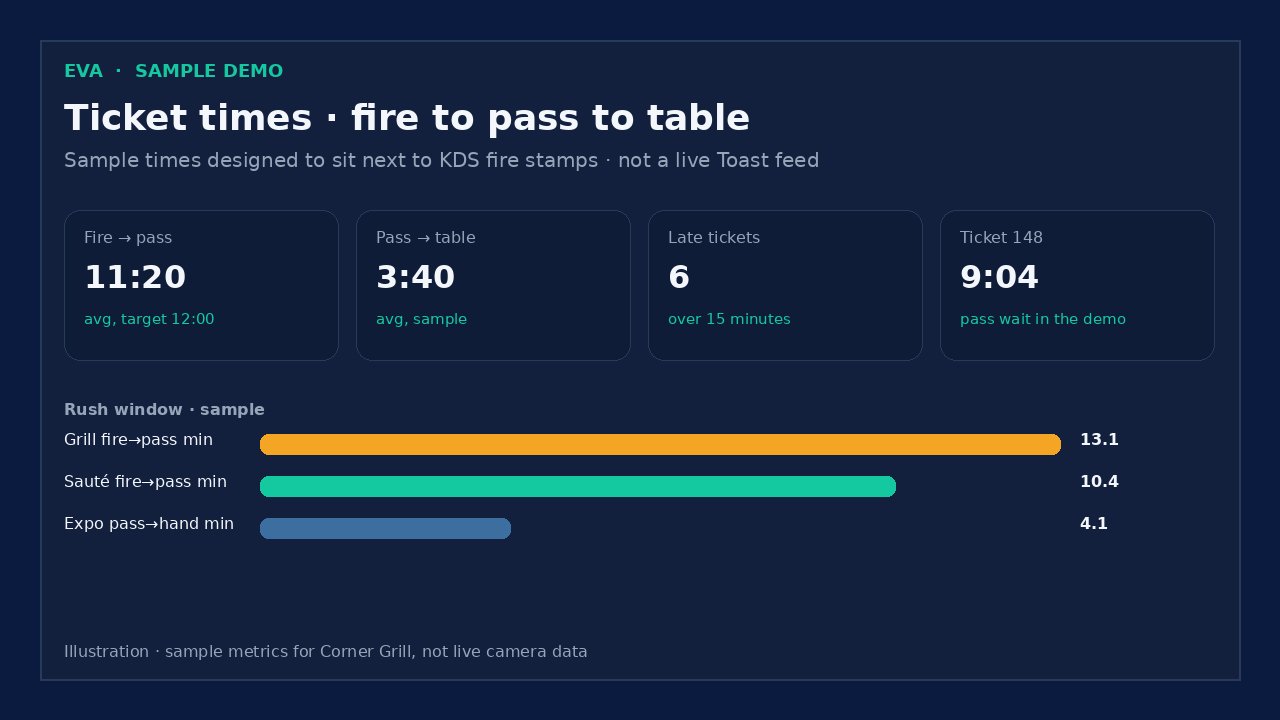
Fire-to-pass. When a ticket is fired on the line, the clock starts. When the finished plate is set on the pass (the pass camera sees it), the clock stops. In the sample, the average is 11 minutes 20 seconds against a 12-minute target. Ticket 148 in the live demo is the same idea in a single alert: fired at 10:33 PM PT, still waiting at 10:42, a 9:04 plate wait.
Pass-to-table. A second clock starts when the plate is ready and stops when a runner takes it, or when a table-status change says the food has landed. The sample average is 3 minutes 40 seconds. This is how a manager separates a slow grill from a slow run.
Late-ticket alerts. Tickets that cross a threshold — 15 minutes in the sample — rise as a watch or an alert on the EVA tile, so the expo does not have to stare at every chit. The demo already shows one late plate at the pass.
Rush breakdowns. Times can be sliced by hour, station, and dish. The sample 7–9 PM rush shows grill fire-to-pass at 13:10, sauté at 10:40, and expo pass-to-hand at 4:05. That points at the grill, not “the kitchen” as a blob.
Kitchen display data, including Toast KDS as an example
Fire times are most accurate when they come from the kitchen display the line already uses, not from a camera guessing when a sauté pan moved. EVA is planned to read ticket-fire timestamps from a kitchen display system. If a restaurant already runs Toast KDS — or another KDS that can share fire times — those stamps can be matched to pass-camera timing and to the ticket number on the rail.
That connection is on the roadmap and is shown here with sample data only. This demo is not a live hookup to Toast, it is not an official Toast product, and it does not imply a partnership with Toast. “Toast KDS” is named as an example of a kitchen display many independent restaurants already have. Other kitchen displays with a usable fire-time feed are in the same planned design.
Fire → pass11:20average · target 12:00
Pass → table3:40average, sample
Late tickets6over 15 minutes, 7–9 PM
Ticket 148 wait9:04shown as a watch in the demo
Grill, rush13:10fire-to-pass, 7–9 PM sample
Sauté, rush10:40fire-to-pass, 7–9 PM sample
Sample data Figures are labeled samples for the fictional Corner Grill location. They are not measured results from a live restaurant and not a promise of performance.
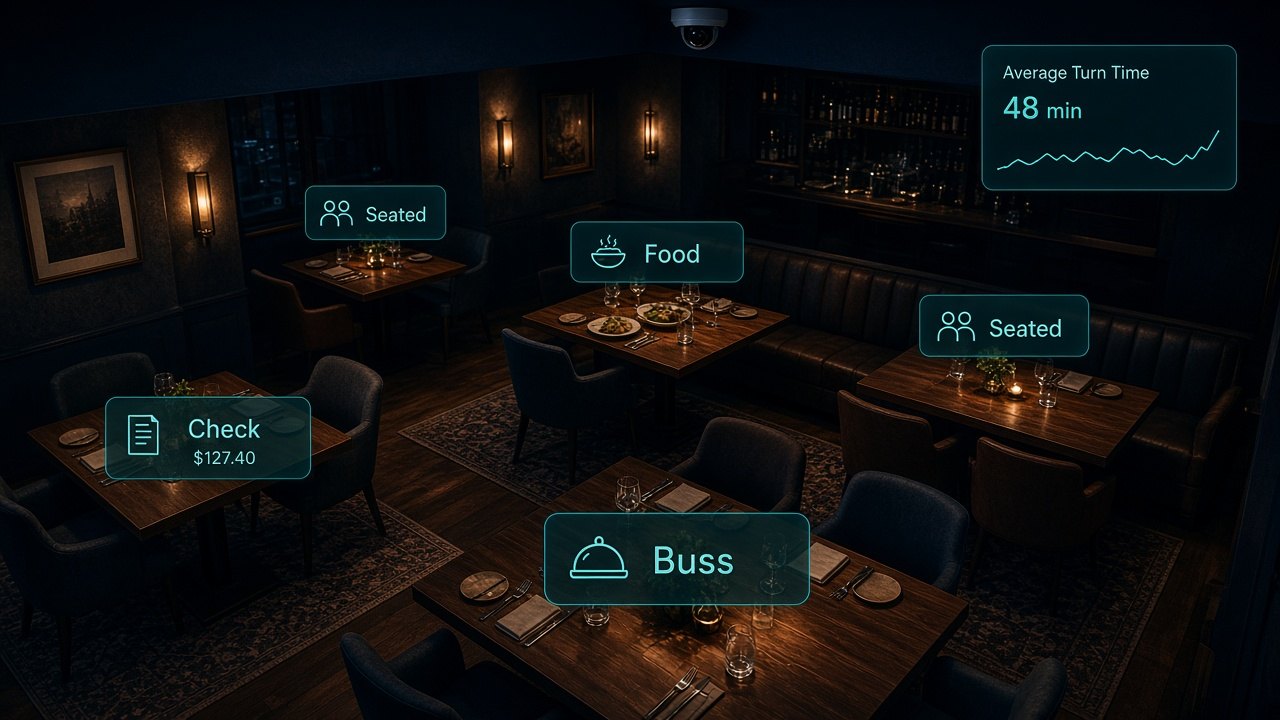
A table earns its keep only when it is ready for the next party. EVA is designed to stamp each stage of a turn and to flag a table that is empty but still dirty while a waitlist is standing.
Illustration — not a product photo Sample table-status overlays on an original dining-room illustration. Status labels are annotations for this artwork, not a live floor map.Illustration — not a product photo Sample turnover metrics. Revenue per seat-hour is an example calculation, not a measured result.
The five stamps.Seated when guests land, ordered when the first ticket fires, food when plates leave the pass or land on the table, check when the bill is opened or settled, and bussed when the table is reset. Together they show whether a long turn was in the kitchen, at the table, or in the aisle with a dirty two-top.
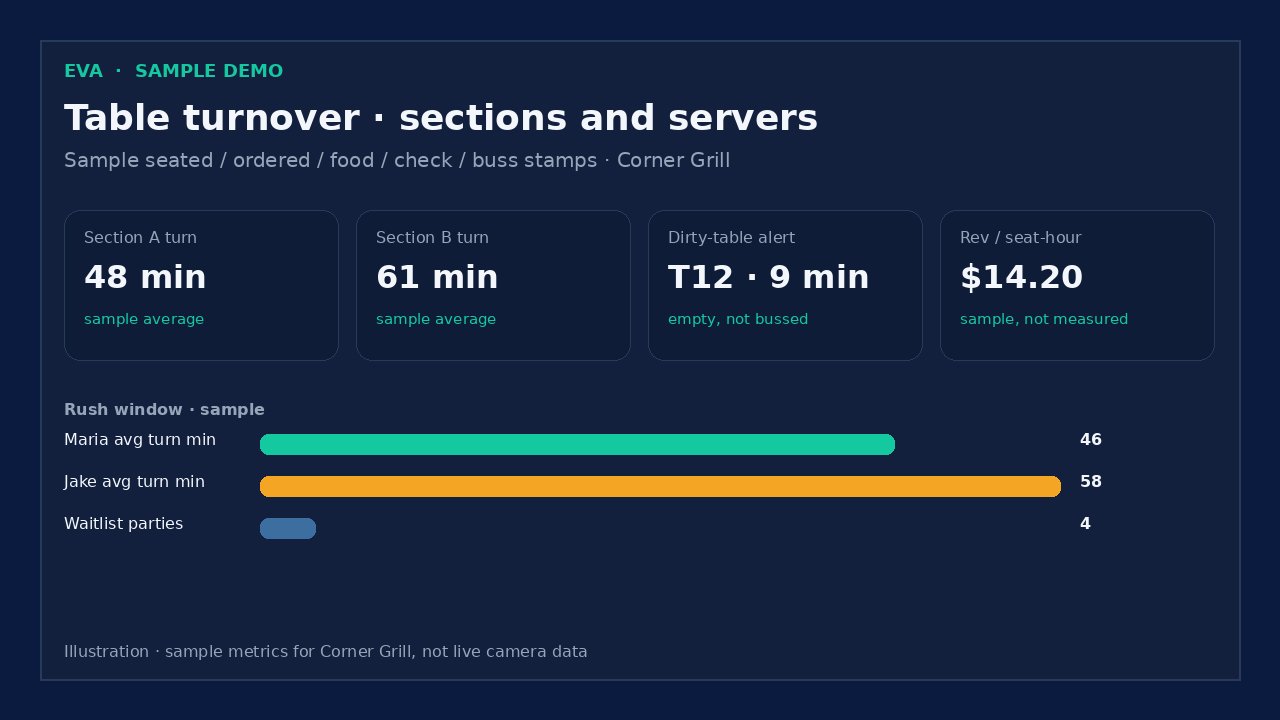
Average turn time per section and server. The sample has Section A at 48 minutes and Section B at 61 minutes. Server averages in the sample — Maria at 46 minutes, Jake at 58 minutes — come from the section and server assignment on the ticket, not from facial recognition on the floor.
Empty, dirty-table alerts. Table 12 in the sample has been empty for 9 minutes and is still not bussed. That alert is meant for the floor, the same way a late plate alert is meant for the pass.
Waitlist impact. If four parties are waiting and two tables are dirty, the hold-up is not “we need more seats” — it is a reset problem. EVA is designed to put those two numbers on the same card.
Revenue per seat-hour. A simple planning ratio: net sales in the window, divided by seats, divided by hours. The sample is $14.20. That figure is an example calculation for Corner Grill, not a measured result and not a promise of higher revenue.
Joining camera table-status with live point-of-sale seated, ordered, check, and closed stamps is on the roadmap. The demo shows the sample metrics and the dining-room illustration so you can see the shape of the report today.
Section A turn48 minsample average
Section B turn61 minsample average
Maria / Jake46 / 58 minfrom ticket assignment, not faces
Dirty-table alertT12 · 9 minempty and not yet bussed
Waitlist4 parties2 dirty tables still holding seats
Rev / seat-hour$14.20example calculation, not a result
Sample data Figures are labeled samples for the fictional Corner Grill location. They are not measured results from a live restaurant and not a promise of performance.
SamplePour vision and auto-matching on the roadmap
4. Inventory and theft signals — variance, doors, and an evidence report
Missing product is usually a puzzle with several pieces: a count, a sale, a door, a void, a delivery, or a drawer. EVA is designed to put a short clip and a timestamp next to that puzzle so a manager can review it. A clip is a signal, not an accusation, and nothing in the demo auto-disciplines anyone.
Illustration — not a product photo Sample after-hours door event. This is original artwork of a back hallway, not a clip from a real restaurant.Illustration — not a product photo Sample variance and event metrics. Illustration of a report, not evidence from a live location.Illustration — not a product photo A sample walk-in shelf count. Labels are annotations for this artwork and match the under-par items already used in the Inventory tile.
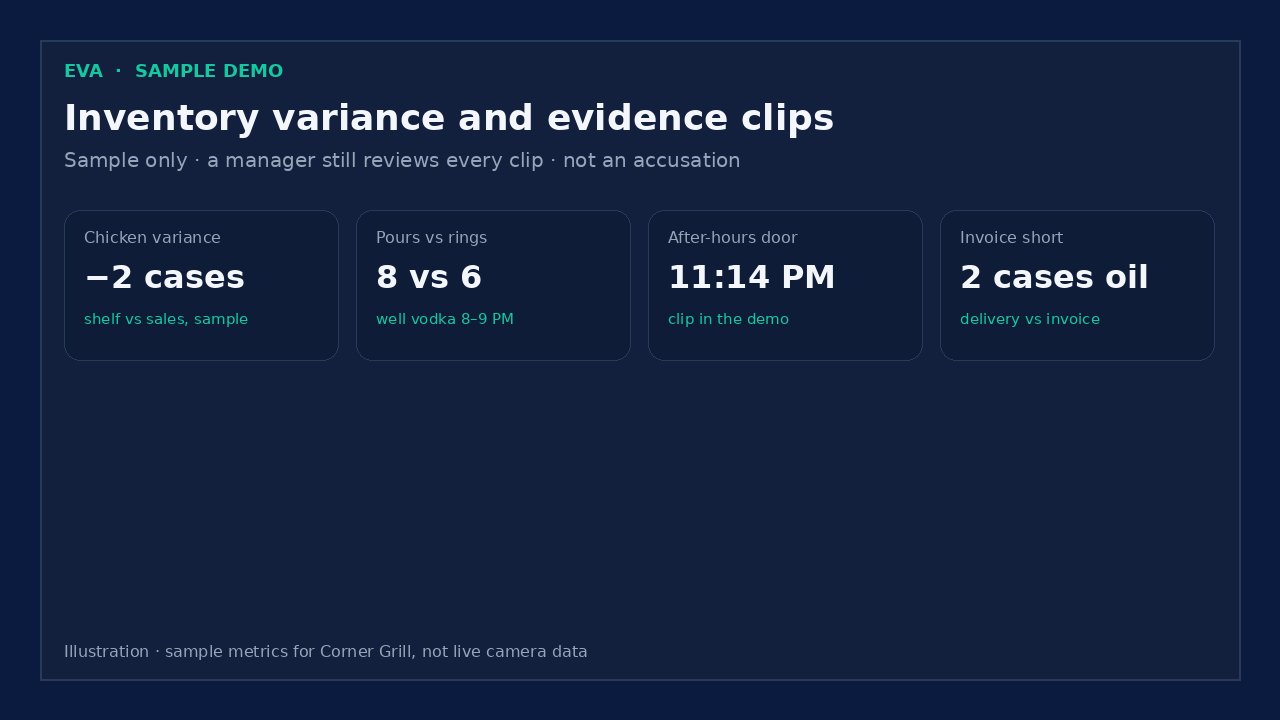
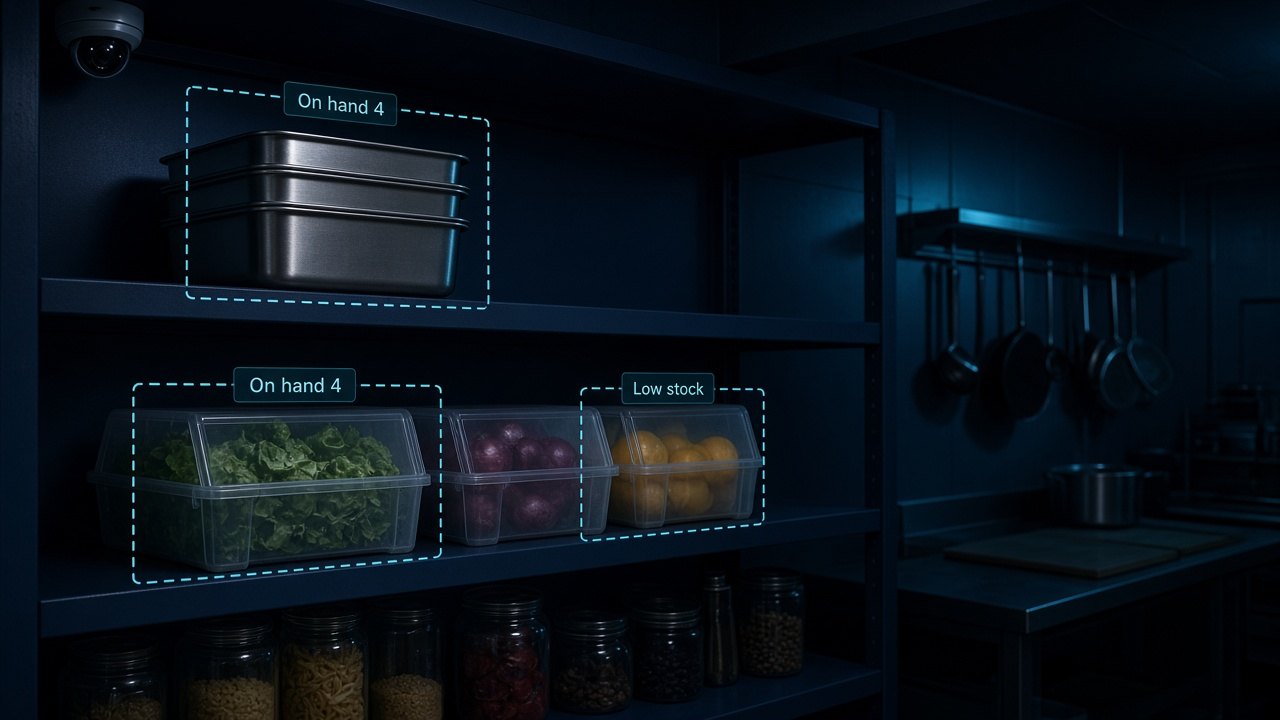
Shelf and walk-in counts vs sales (variance). A snapshot count is compared with what was sold. In the sample, chicken is two cases short of what sales and the last count would predict. Oil and chicken in the 9:05 PM PT walk-in snapshot are already under par on the Inventory tile — the same short items, two views.
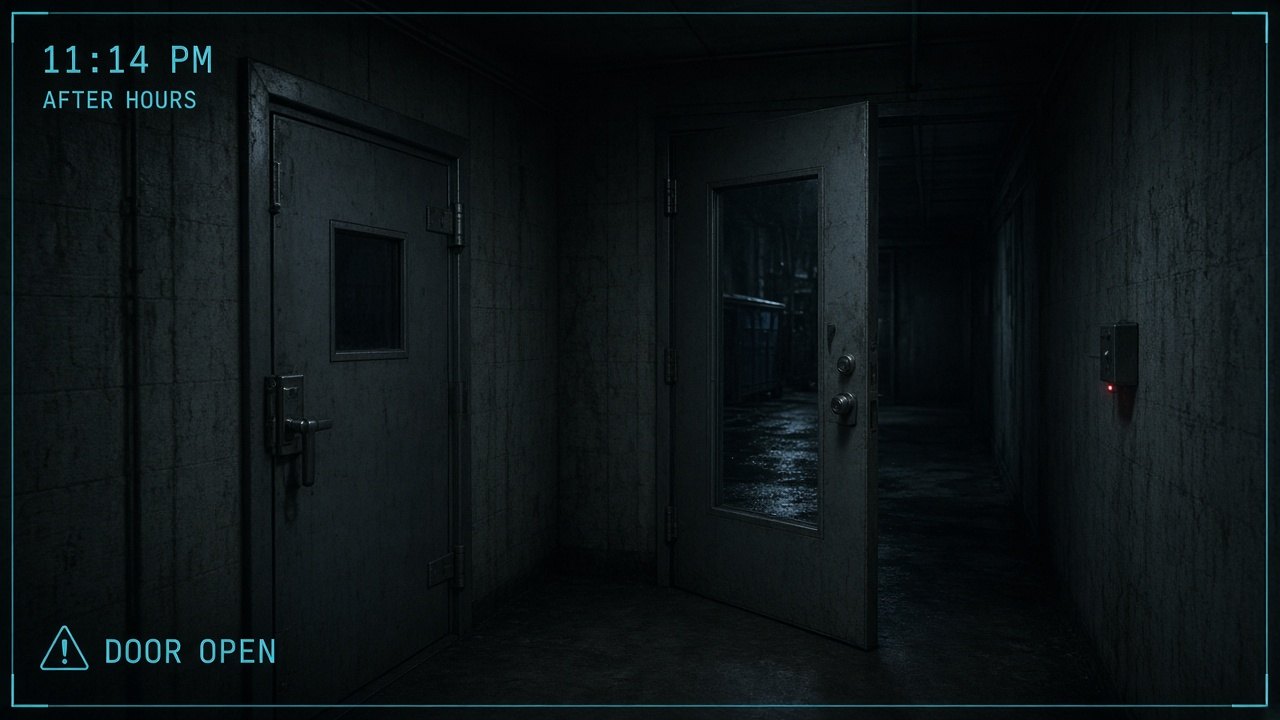
Back-door and after-hours activity. A rear exit held open, or a door after close, raises an alert. The live demo already includes a propped back door (6 minutes at 10:36 PM PT in the evening sample) and this page uses an after-hours still at 11:14 PM PT so you can see the night case.
Bar pours vs rings. A camera over the well can be trained to count pours and compare them with items rung on the ticket. The sample shows 8 pours and 6 rings on well vodka between 8 and 9 PM. Pour-level computer vision is on the roadmap; the figure here is a sample of the report, not a live pour counter.
Voids and comps matched to clips. When a manager comps or voids a ticket, EVA is designed to attach the pass or register clip from that minute. Ticket 144 in the sample has a void with a clip on file. Matching is planned; the demo shows the shape of the row, not a live POS void feed.
Deliveries vs invoice shortages. If two cases of oil are on the invoice and the walk-in count after delivery is short, the receiving door clip from that window is the first place to look — a short shipment, a miscount, or product that left the dock. The sample shortage is two cases of oil.
Cash-drawer events. A no-sale drawer open, or a drawer after close, can be lined up with the register camera. The sample notes a no-sale open at 10:51 PM PT. This is a review cue for the manager, not an automatic theft finding.
Chicken variance−2 casesshelf count vs sales, sample
Pours vs rings8 vs 6well vodka, 8–9 PM, sample
After-hours door11:14 PM PTclip on the evidence report below
Invoice short2 cases oildelivery vs invoice, sample
Void + clipTicket 144matched still, planned live hook
Cash drawer10:51 PM PTno-sale open, sample
Sample data Figures are labeled samples for the fictional Corner Grill location. They are not measured results from a live restaurant and not a promise of performance.
Sample manager evidence report
Sample report Built so a manager can review a clip with a timestamp. This is not from a real restaurant and it is not a finding of theft.
Location
Corner Grill (fictional demo site)
Event
Rear exit door open after hours
Camera
Back door / rear hallway
Timestamp
Wednesday, 11:14 PM Pacific Time (America/Los_Angeles)
Clip
Sample still, 18 seconds · labeled “not a live feed”
Related counts
Walk-in chicken variance −2 cases (sample) · no matching late invoice in the window
Related POS
No ticket, void, or paid-out in the same minute (sample)
Access
Owners and designated managers only
Manager review
Open — EVA does not close this as theft. A person still decides what, if anything, happened.
Hardware, placement, and how video is processed
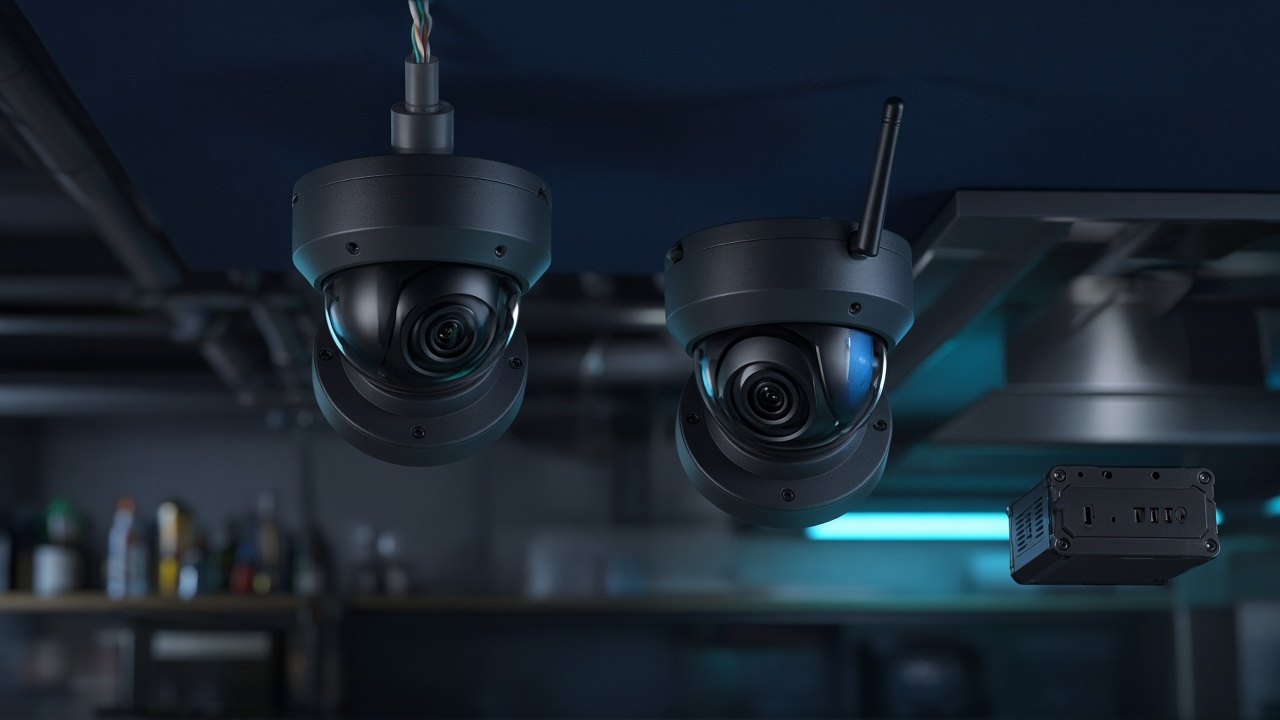
EVA uses compact, unbranded-style fixed cameras aimed at work areas. The illustrations below are original artwork, not a vendor catalog and not a photograph of another company’s camera.
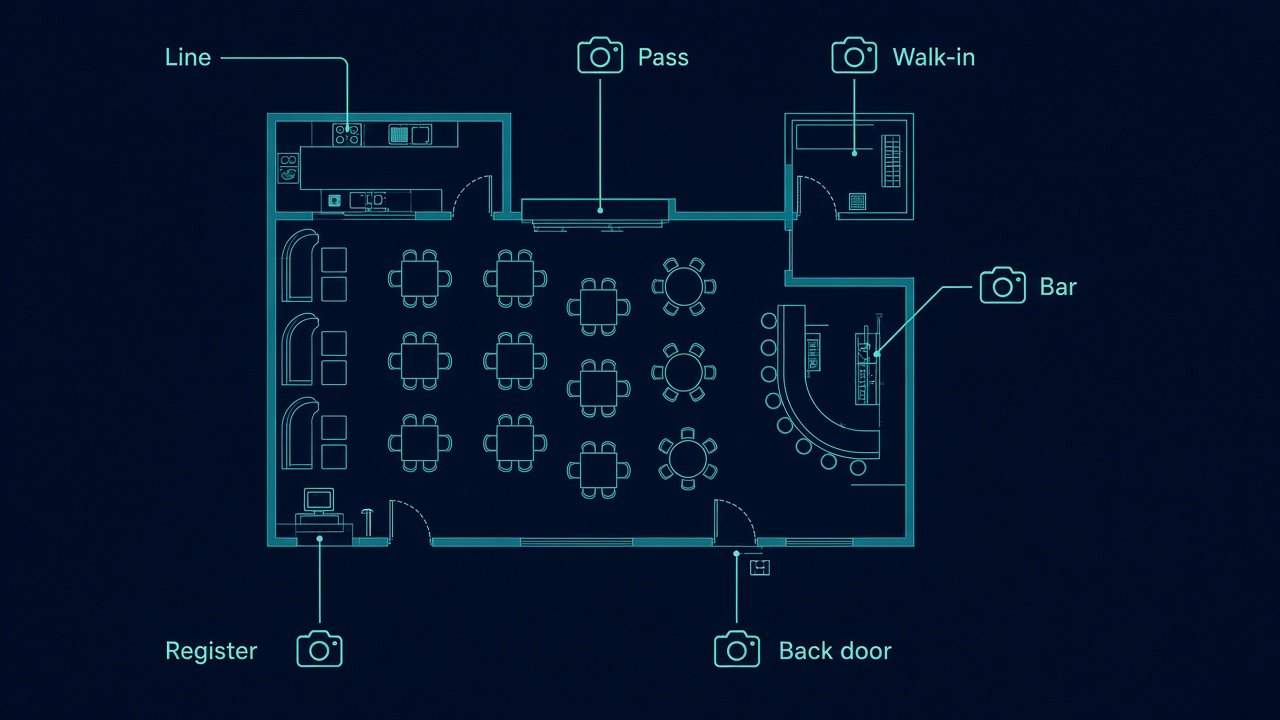
Illustration — not a product photo A PoE dome, a Wi-Fi-style dome, and a small edge box. This is an illustration of the idea, not a specific product SKU.Illustration — not a product photo A sample six-camera layout: line, pass, walk-in, bar, register, and back door. Every room on this plan is a work area; restrooms and break rooms are not shown because they are not EVA camera locations.
PoE vs Wi-Fi
Power over Ethernet (PoE) is the usual recommendation on a line or pass: one cable carries power and video, and the run is less likely to drop in a busy kitchen. Wi-Fi can be a fit for a temporary view or a space where pulling cable is hard, with the usual tradeoff — more interference, more attention to signal, and a separate power path. The hardware illustration shows both so an owner can see the difference; it is not a shopping list for a named brand.
Edge processing
Whenever it is practical, short event clips and counts are processed on a small box on site (the “edge”) so a full uncut video stream does not have to live in the cloud to flag a late plate or an open door. What a manager sees in DASH is the alert, a still or a short clip, and the timestamp. Retention and where full video is stored should be a written choice with your installer; this page is not a legal policy.
Night vision
Back doors and walk-ins are often dim after close. Cameras in those spots need a usable infrared or low-light picture so an after-hours door event is actually reviewable. The 11:14 PM PT still on this page is an illustration of that night case.
Where the six sample cameras point
Line — down the cook stations, for coverage and fire-to-pass context.
Pass — along the plating shelf, for plate-wait timers and the ticket-time leg that starts when food is ready.
Walk-in — along the shelves, for snapshot counts that feed Inventory and variance.
Bar — over the well and back bar, for pour-vs-ring reports (roadmap) and after-hours motion.
Register — the cash drawer and void or no-sale window, not a guest’s card number or PIN.
Back door — the opening and the hallway, for propped and after-hours alerts, not a detailed view of a parking lot or a neighboring business.
What EVA is designed to see, flag, and report
On the line and at the pass
Plates landing and waiting, ticket numbers in view, a station left empty in a rush, and the two clocks that matter: fire-to-pass and pass-to-table. Ties to Reviews when guests mention slow service, and to Labour when a coverage gap matches a late bank of tickets.
In storage
Shelf snapshots, case and pan counts, items already under par, and a variance against sales. Ties to Inventory and Food Cost. A count is a snapshot, not a promise that theoretical food cost will fall.
At the door, bar, and drawer
Propped or after-hours doors, receiving shortages against an invoice, a no-sale drawer, and — on the roadmap — pours compared with rings, plus voids or comps with a clip attached.
Daily report (sample shape)
A morning card can list late tickets, coverage gaps, dirty-table holds, variance items, and any door or drawer events, each with a timestamp and a clip when one exists. The Corner Grill figures on this page are what that report looks like in sample form.
Alerts also appear on the EVA Cameras tile in the demo so a manager can act from one screen, then jump to Inventory, Food Cost, Maintenance, or Labour when the same issue shows up there.
A sample setup timeline
Every dining room is different, so this is a planning outline, not a guaranteed install calendar.
Walk-through (week 1). Pick work-area views only. Agree on notice to staff. Confirm cable paths for PoE where you can.
Install and aim (week 2). Mount the agreed cameras, set night-vision on doors and walk-ins, and put a small edge box on the network.
Tune and train (weeks 3–4). Teach the pass what a ready plate looks like, teach the walk-in the shelves that matter, and set late-ticket and door-open thresholds.
Manager routine (ongoing). Use the daily report and the EVA tile. Review evidence clips in person before any staffing decision. This is not legal advice.
What the live demo shows today vs what is on the roadmap
The demo uses sample data for a fictional location, Corner Grill. It is not a live camera feed.
Topic
In this demo now
On the roadmap
Employee movement
Sample heatmap illustration, coverage and bottleneck metrics, no facial recognition
Live station heatmaps and coverage clocks from the cameras
Ticket times
Plate-wait watch on ticket 148, sample fire-to-pass and pass-to-table figures
A planned hook to kitchen-display fire times (Toast KDS named as an example source, not a partnership)
Table turnover
Sample stamps, section and server averages, dirty-table and waitlist figures
Live seated / ordered / food / check / buss stamps joined to the POS
Live variance, pour-vs-ring vision, void/comp clip matching, delivery and drawer events as a continuous feed
Privacy and compliance notes
Kitchen cameras are a serious tool. This is a general product description, not legal advice. Rules vary by city and state, and audio is often treated more strictly than video.
Place cameras in work areas (the line, pass, storage, bar, register, and exits). Do not aim them at restrooms, locker rooms, break rooms, or other spaces where staff have a reasonable expectation of privacy.
Tell staff that cameras are in use, what they are for, and who can open a clip. Posted notice is the baseline; some places require more.
Facial recognition is off by default. Movement and turnover views are about stations, tickets, and tables, not a biometric identity score.
Access should be limited to owners and designated managers. Clips and figures in the demo are samples and are not from a real restaurant.
Guest dining-room recording is not the default story for EVA on this site. Table-turnover illustrations show how a status overlay could look; turning that on in a real dining room should be a deliberate, disclosed choice.
Audio recording, if used at all, has extra consent rules in many places, including all-party consent states such as California. The illustrations and the demo focus on visual events.
Write down how long clips are kept and who may export them. EVA can support a short, review-focused retention window; the right number is a policy decision, not something this page can set for you.